Housing Inventory declines 20.07% year-over-year!
No commentsRealtor.com: May 2012 Real Estate Data
Released – June 16, 2012
 Some more good news about the current Real Estate market. See below what was written in the last month Real Estate Data issue at Realtor.com, and definitely check out the full chart with all the cities and markets and their statistics, since they differ vastly. For example, check the Phoenix-Mesa, Arizona market, there are is some incredible development in the numbers: the median prices went up 33% since May 2011 and the inventory fell 45% in the same period! This is a great news for me, since one of the first 2 investment properties (condos) I bought 3 years ago is in Phoenix and I am starting to consider selling it this year, so I would be able to push more money in my multifamily property in Kansas, or possibly purchase another property in a market which has better performance in the long term holding strategy (higher positive cash flow).
On the national level, inventory of for-sale single family homes, condominiums, townhouses and co-ops declined by -20.07% in May 2012 compared to a year ago, and declined in all but two of the 146 markets covered by REALTOR.com.
The median age of the inventory fell -9.78% on a year-over-year basis last month, and the median national list price increased 3.17% last month compared to May 2011. Read the rest of this entry »
Warren Buffet on the USA Housing Market
2 comments so farBerkshire Hathaway
February 25, 2012 | Warren E. Buffett
 Warren Buffett makes several key USA housing points in the annual Berkshire Hathaway Shareholder meeting, which are quite interesting for all foreign investors who are considering buying house in usa:
Housing completions have been at record lows.
1 ) There are currently more households being formed than new housing units completed, and this is decreasing the excess supply.
2 ) The excess supply will be “sopped up” at different rates across the country.
3 ) Housing is a key reason for the sluggish economy (not the only reason).
Housing will come back – you can be sure of that. Over time, the number of housing units necessarily matches the number of households (after allowing for a normal level of vacancies). For a period of years prior to 2008, however, America added more housing units than households. Inevitably, we ended up with far too many units and the bubble popped with a violence that shook the entire economy. That created still another problem for housing: Early in a recession, household formations slow, and in 2009 the decrease was dramatic.
That devastating supply/demand equation is now reversed: Read the rest of this entry »
Apartment Vacancy Rate falls to 5.2% to 2001 Level
5 comments so farThe nation’s apartment-vacancy rate in the fourth quarter fell to its lowest level since late 2001 as Americans continued to favor renting homes instead of buying them.
 Reis Apartment Vacancy Rate (click to enlarge)
In the fourth quarter, the vacancy rate fell to 5.2% from 6.6% a year earlier and 5.6% at the end of the third quarter, according to Reis.
During the depths of the downturn, landlords had to offer incentives such as flat-screen TVs and months with no rent to attract tenants. However, in the fourth quarter of 2011, landlords in 71 of the 82 of the markets that Reis follows were able to raise rents. Nationwide, landlords raised asking rents an average of 0.4% in the fourth quarter, to $1,064 a month. That’s up from $1,026 in 2009. Read the rest of this entry »
CoreLogic: 10.9 Million U.S. Properties with Negative Equity in Q2
2 comments so farCoreLogic released negative equity data for Q2 2011 showing that 10.9 million, or 22.5 percent, of all residential properties with a mortgage were in negative equity at the end of the second quarter of 2011, down very slightly from 22.7 percent in the first quarter.
An additional 2.4 million borrowers had less than five percent equity, referred to as near-negative equity, in the second quarter. Together, negative equity and near-negative equity mortgages accounted for 27.5 percent of all residential properties with a mortgage nationwide. The new report also shows that nearly three-quarters of homeowners in negative equity situations are also paying higher, above-market interest on their mortgages.
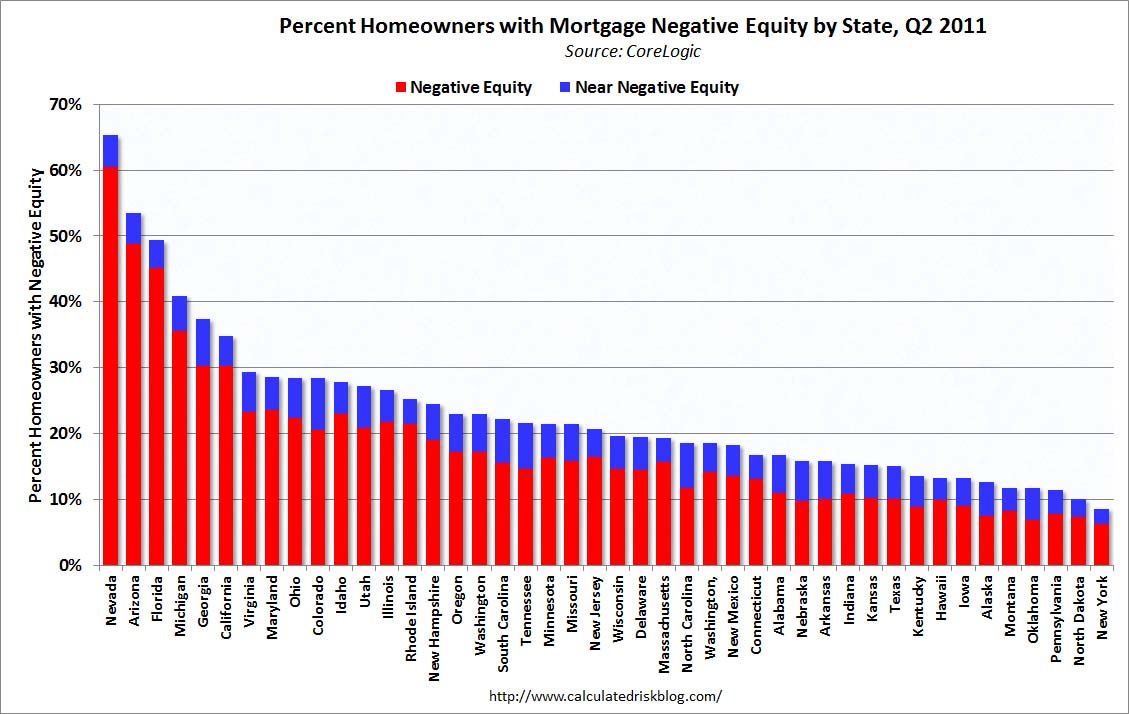 Negative Equity By State (click to enlarge)
From CoreLogic: Nevada had the highest negative equity percentage with 60 percent of all of its mortgaged properties underwater, followed by Arizona (49 percent), Florida (45 percent), Michigan (36 percent) and California (30 percent). Read the rest of this entry »
USA Update: Real House Prices and Price-to-Rent
6 comments so farCalculated Risk Finance & Economics blog, July 26, 2011
Real House Prices
 Real House Prices in the USA (click to enlarge)

Below are two graphs showing real prices and price-to-rent ratios for residential homes in the USA. Real prices are back to 1999/2000 levels, and the price-to-rent ratio is also back to 2000 levels in real terms (adjusted for inflation using CPI less Shelter). Note: some people use other inflation measures to adjust for real prices. In real terms, the National index is back to Q4 1999 levels, the Composite 20 index is back to August 2000, and the CoreLogic index back to March 2000. Read the rest of this entry »
Rents Rise, Vacancies Go Down
6 comments so farWall Street Journal, Real Estate, July 7, 2011
Vacancies … fell in 72 of the 82 markets during the second-quarter vacancy rate to 6%, the lowest since 2008 and compared with 7.8% a year earlier, according to Reis. […]
The average effective rent, the amount paid after discounting, was $997 in the second quarter of the year, up from $974 a year earlier […]
Landlords filled a net 33,000 units in the second quarter, a slowdown from the 45,000 units they filled in the first quarter. […]
Meanwhile, supply remains constrained. Roughly 8,700 new apartment units opened during the second quarter, the second-lowest quarterly tally for new completions since Reis began collecting data in 1999.
A few key points:

- Vacancy rates are falling fast (the excess supply is being absorbed). Note: The excess housing supply includes both apartments and single family homes.
- A record low number of multi-family units will be completed this year (2011). Only 8,700 apartments came on the market in Q1 (in the Reis survey area). This is the second lowest quarter since Reis has been tracking completions – the lowest was 6,000 last quarter.
- The falling vacancy rate is pushing push up effective rents. This also pulls down the price-to-rent ratio for house prices.
Wall Street Journal Article Link
Keeping track of expenses and incomes for your accountant (CPA)
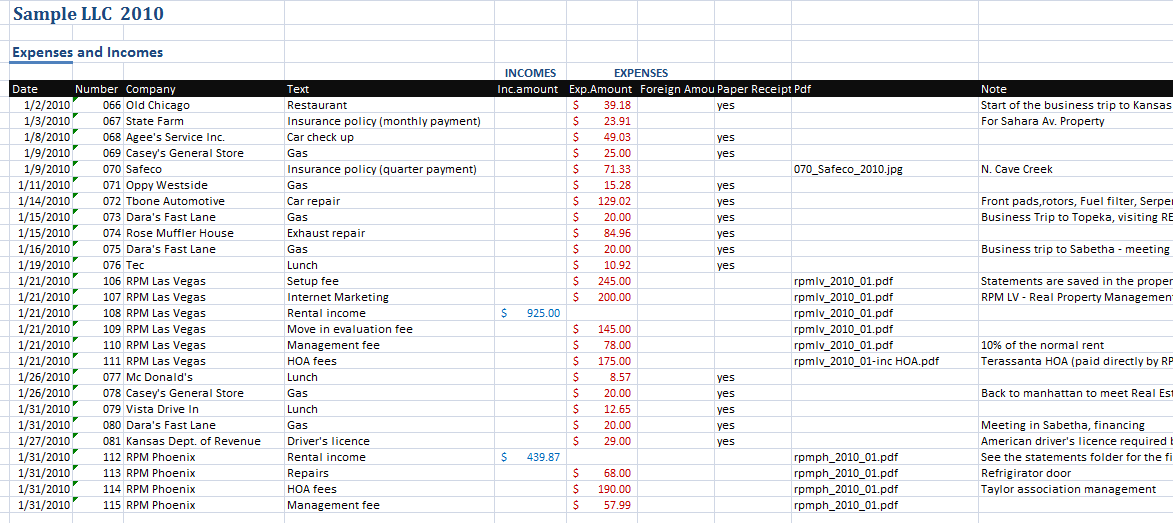
2 comments so farIn one of the last posts here at Buying Property in USA blog, I shared with you my file for keeping track of each individual investment property incomes/expenses and other data. There is one more file you will need though, if you have also founded an LLC and have a CPA (accountant) who is preparing your taxes. I have again just created an excel spreadsheet table for this purpose, nothing fancy. It can just save you a couple of hours figuring out the best way of keeping track of these numbers.
On the image below (click to enlarge) you can see the sample table:
How Home Prices Declined in 25 Largest Metro Areas
4 comments so farIn this post, I will just republish data put together by Zillow. It is always important to do the market research before buying real estate in USA, because the market decision is sometimes even more important than the decision about the particular property. Anyway, thanks to servers like Zillow, the market research is quite simple.
According to Q1 2011 Zillow® Real Estate Market Reports, here are the declines in 25 largest metro areas. Read the rest of this entry »
One year of investment property operation data in Phoenix, Arizona
12 comments so farFollowing my Las Vegas property 1-year break down, I am going to present to you the numbers for my second property in Phoenix, AZ. I also bought this condominium on N Cave Creek Rd during my 3week trip to the USA in the summer 2009. It was much easier to find the investment property in Phoenix (in fact it took me just one afternoon), but how did this property do during the first year of operation? Here is the table (click to enlarge):
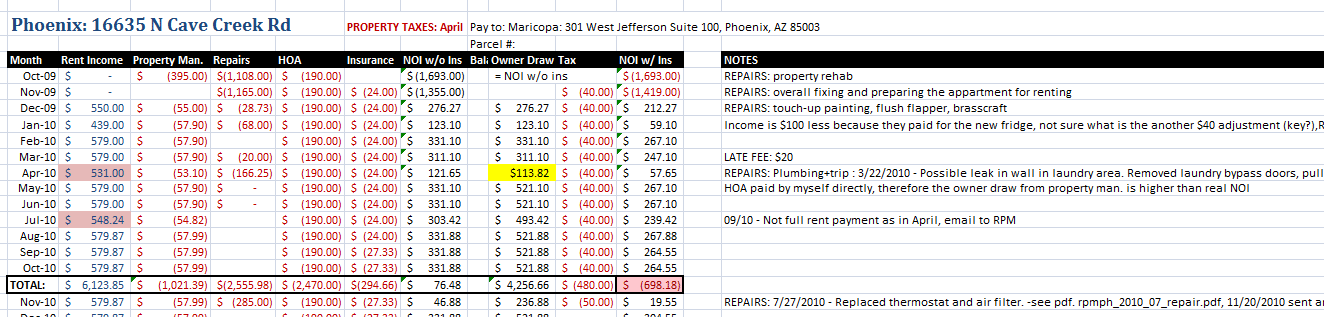
As you can see, I already started with some rehabs in October 2009, but since it was from the middle of the month, I counted November as the first month. Therefore the official first year of operation is ending by the end of October 2010 the same as my Las Vegas property. You can see again, that I was charged initially for the property management fee by RPM Phoenix Metro. This property however was in worse shape than the one in Las Vegas. We needed to put new windows in, change a couple of doors, cabinets and paint the whole place. This rehab project was, in the end, quite expensive and you can see these expenses in the repairs column. Read the rest of this entry »
One year after buying property in USA (Las Vegas) – numbers, thoughts, strategy
24 comments so farI owed you guys who are following the Buying Property in USA blog this post already for a few months. It has been 1 year since I bought my properties in Las Vegas and Phoenix already last October (2010). However I was in the middle of purchasing a new property in Topeka, Kansas and also working on my property analysis tool, and therefore I didn’t write a proper post and haven’t done the calculations. Finally it’s here though, and it should be something important for all investors who followed my journey and my articles or are thinking about investing in the United States.
Why? Because, now I will be able to do an exact comparison of the returns I was expecting more than a year ago (when I went to the US and purchased the 2 properties) and the actual REAL results, after one year of ownership – the real incomes, real expenses and maybe the not so glorious TRUTH.
Las Vegas
So let’s start with my first property, Condominium located on E Sahara Ave in Las Vegas. Below you can see the table for the first year of operation (click to zoom in):
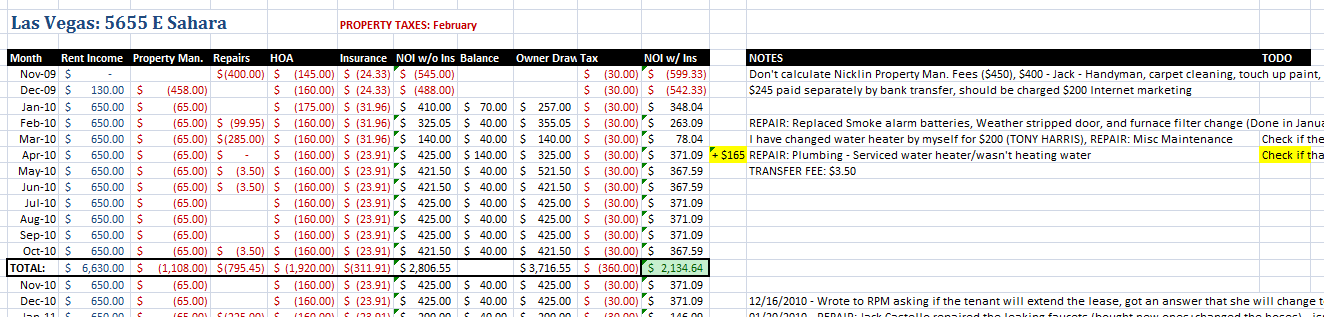
The closing was in the end of October 2009, so I counted November as the first month of operation. There were some “repairs” in November, but basically it was just carpet cleaning, a few fixes and touch up paint for $400. Otherwise the unit was ready to be rented out. Read the rest of this entry »